

On August 17th, the cryptocurrency market encountered a substantial wave of selling with Bitcoin leading the downward charge. This notable sell-off was triggered by SpaceX’s announcement to divest its Bitcoin holdings, effectively magnifying the selling pressure across the crypto landscape. Thus, the BTC price showcased a 7% intraday loss leading to a breakdown below the multi-month support trendline. This breach signals the possibility of an extended correction phase for the largest cryptocurrency
Bitcoin Daily Chart: Key Points
- Within a fortnight, the BTC price plunged from the $30789 upswing to the current price of $26462 registering a 14.4% loss
- The Ethereum fear and greed index at 39% reflects negative sentiment among traders
- The intraday trading volume in Bitcoin is $17.4 Billion, indicating a 49% loss.
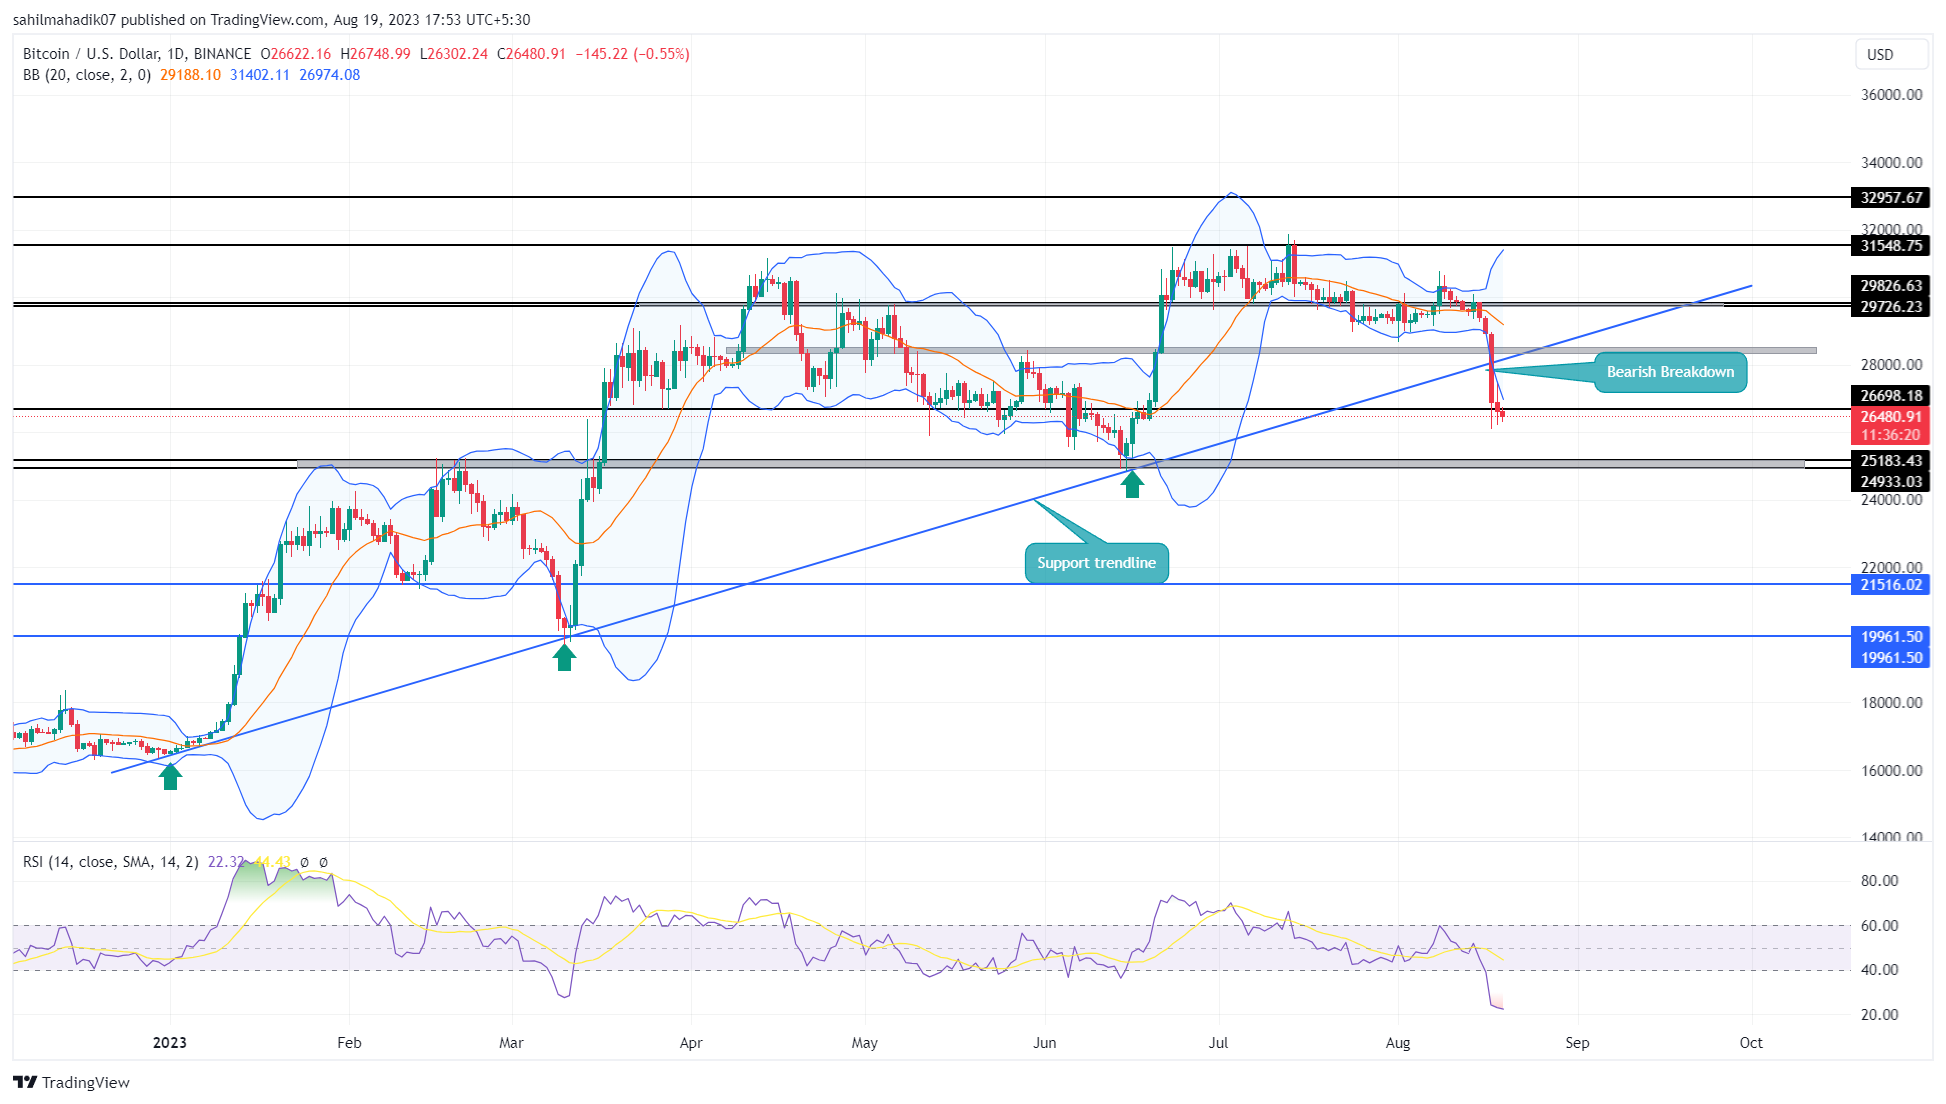 Source- Tradingview
Over the course of the past nine months, BTC price enjoyed a robust uptrend bolstered by an ascending support trendline. Throughout this period, the lower trendline acted as a stronghold for buyers, encouraging accumulation during price dips.
However, the equilibrium was disrupted on August 17th when Bitcoin suffered a 7% decline and pierced through the dynamic support. This breakdown has the potential to shift market sentiment from a “buying on dips” approach to a “selling on rallies” strategy.
Should the coin price manage to maintain its position below the breached support, the mounting selling pressure could propel Bitcoin value toward critical support levels at $25000 and subsequently $21500. A breakdown below the $25000 swing low would signal the seller undermined the principle of Dow theory and also provide further affirmation of a prolonged period of decline.
Right Time to Short Bitcoin?
Given this backdrop, a minor pullback in BTC price is anticipated. This correction could potentially facilitate a retest of the breached support trendline. However, the sustainability of the coin price below the ascending trendline could present an attractive short-selling opportunity for traders who are keen on capitalizing on the prevailing downward momentum.
- Bollinger Band: An downslope in the lower band on the Bollinger band indicator reflects high momentum selling in this coin
- Relative Strength Index: The daily RSI slope at 21% reflects an oversold Bitcoin value and a high possibility of a bullish pullback.